Key Findings from the GHG Inventory
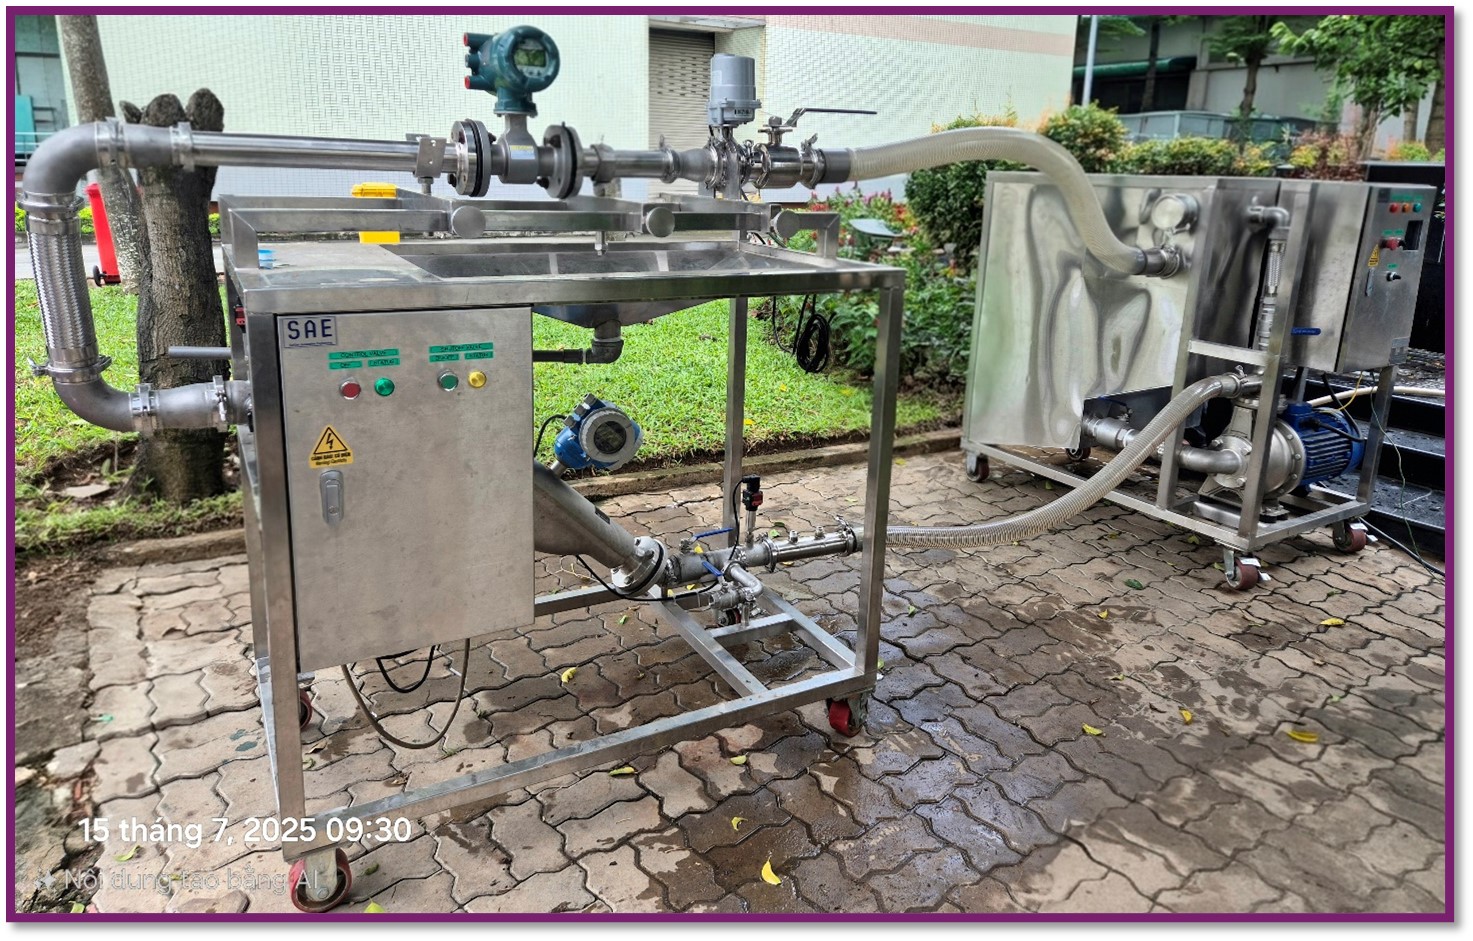
The report was conducted at QUATEST 3’s headquarter (49 Pasteur Street, District 1, Ho Chi Minh City) and its Bien Hoa Laboratory facility covering the period from January 1st to December 31st, 2024. The result clearly identifies direct emission sources (Scope 1), indirect emission sources from generator (Scope 2) and other indirect emission sources (Scope 3), such as those from transportation, business travel and vehicle rental. Data was collected through invoices, delivery notes, electricity consumption logs and staff interviews.
QUATEST 3 recorded total GHG emissions of 2,802.89 tonnes of CO2 equivalent (tCO2e) for 2024, encompassing all three scopes of emissions:
- Scope 1 (Direct emissions): 447.38 tCO2e, accounting for approximately 15.96% of total emissions. These emissions arise from on-site activities including fuel combustion (generators, forklifts), industrial processes (laboratories using chemicals, equipment) and GHG leaks from equipment systems.
- Scope 2 (Indirect emissions from generator): 2,207.74 tCO2e (approximately 78.77% of total emissions). The figure reflects emissions associated with electricity consumed at QUATEST 3, calculated using national grid emission factors.
- Scope 3 (Other indirect emissions sources): 153.33 tCO2e of 5.47% of the total. These emissions stem from off-site activities related to the center’s operations, such as business travel by car, taxi and air.
In addition to emissions, QUATEST 3 has contributed to carbon absorption through green space initiatives. A total of 142 trees within its premises absorbing an estimated 5.56 tCO2e over the year, which helps offset a small portion of 0.2% of total emissions demonstrating the positive role of urban greenery in offsetting net emissions.
The proportion of emissions according to Scope is illustrated in the chart below. Scope 2 emissions from electricity consumption dominate by nearly 79% while Scope 1 and Scope 3 contribute about 16% and 5% respectively. This distribution reflects the characteristics of QUATEST 3 as a technical service provider, where electricity-intensive devices and air conditioning are significant sources of emissions, whereas on-site fuel use and transportation contribute less substantially.
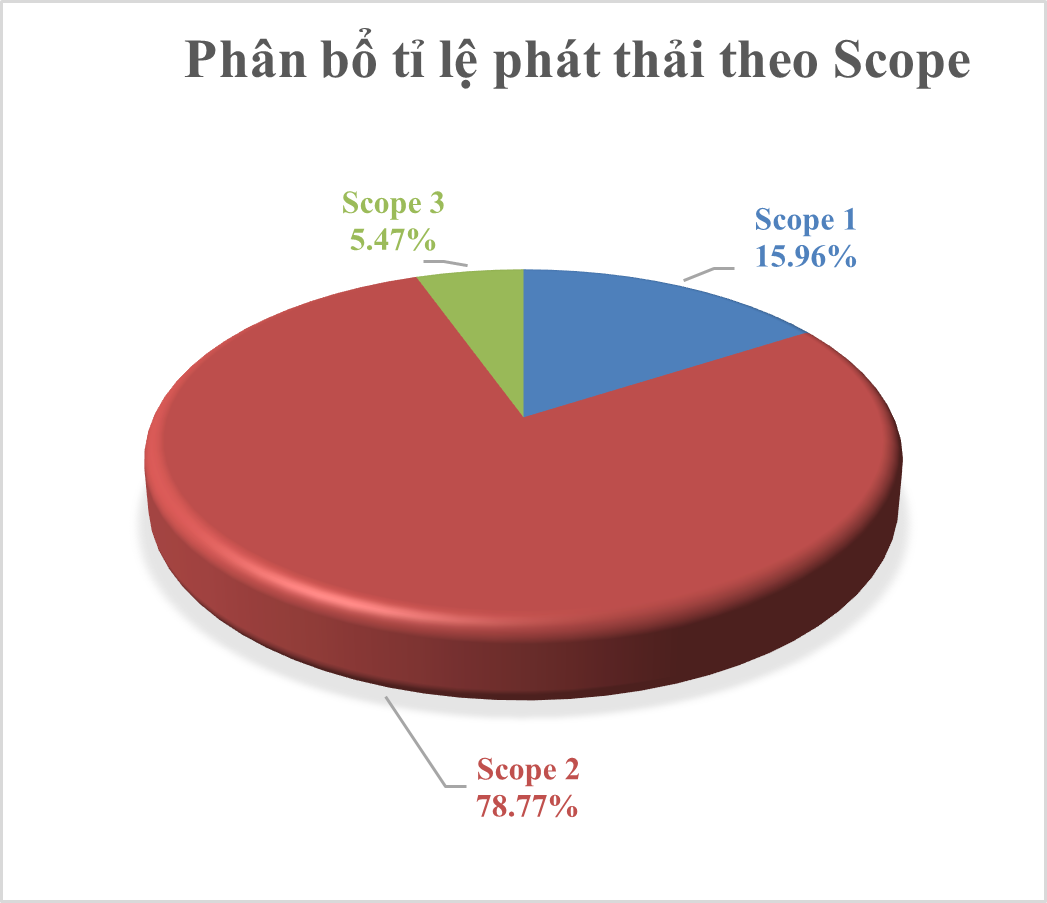

GHG emissions distribution by Scope (Scope 1 – Direct Emissions, Scope 2 – Indirect Emissions from Electricity Consumption, Scope 3 – Other Indirect Emissions Sources). Scope 2 notably accounts for nearly 4/5 of total emissions
The classification and qualification of emissions were conducted using nationally recognized formulas and emissions factors published by the Ministry of Natural Resources and Environment.
In-depth analysis
To visualize the contribution of each category, the chart underscores the dominant share of Scope 2 in QUATEST 3’s total carbon footprint. Electricity consumption alone (2,207.74 tCO2e) contributed nearly five times greater than the 447.38 tCO2e from direct emissions from Scope 1, which highlights the critical importance of effective electricity management and savings at the center. Scope 3, although smaller in proportion, includes transport and business activities – areas that are often overlooked when organizations focus solely on direct, on-site emissions. The chart also shows that the absorption rate from trees is minimal compared to the total emissions (around 0.2%). Therefore, while tree planting is beneficial, there needs a combination of a broader set of mitigation strategies to achieve meaningful reductions in net emissions.
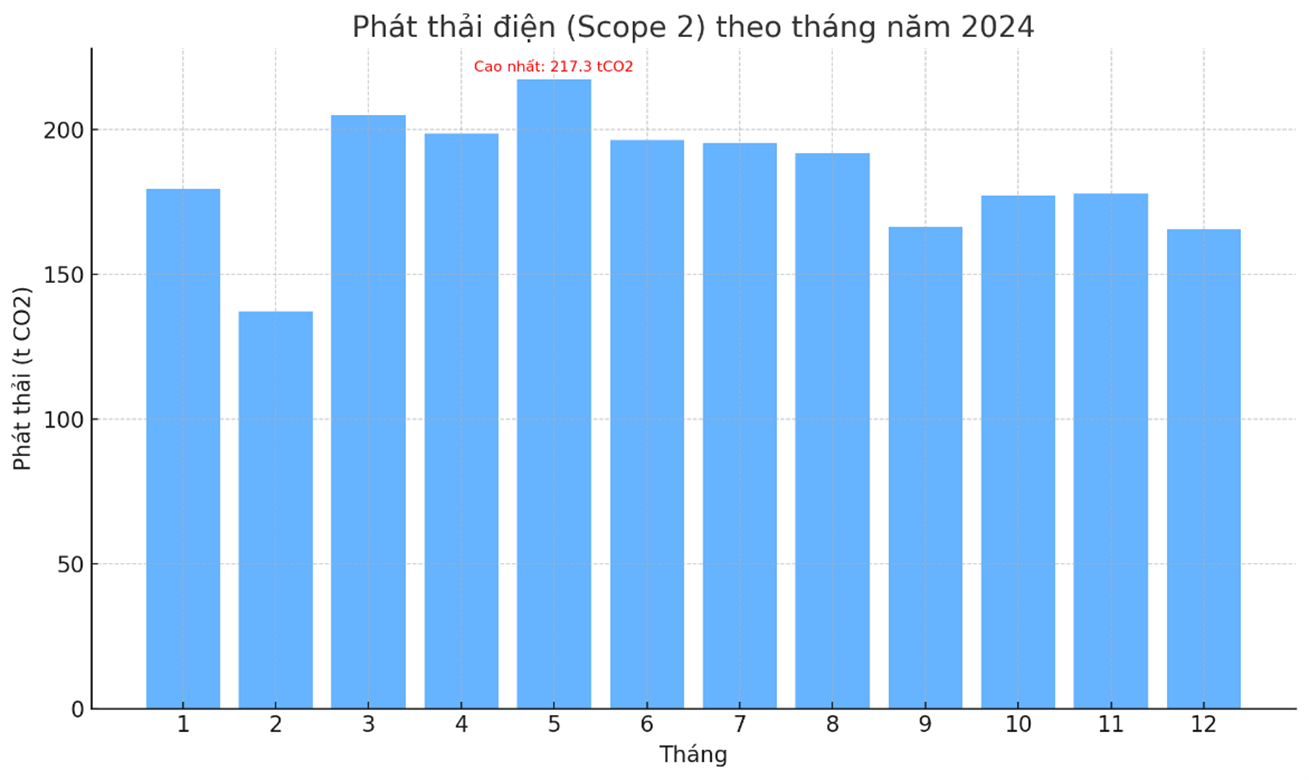
QUATEST 3’s monthly Scope 2 emissions indicate that May recorded the highest emissions level (about 217 tCO2) due to the consumption pf 329,590 kWh of electricity. In contrast, February showed the lowest amount of around 137 tCO2 (208,152 kWh) due to the long holiday period.
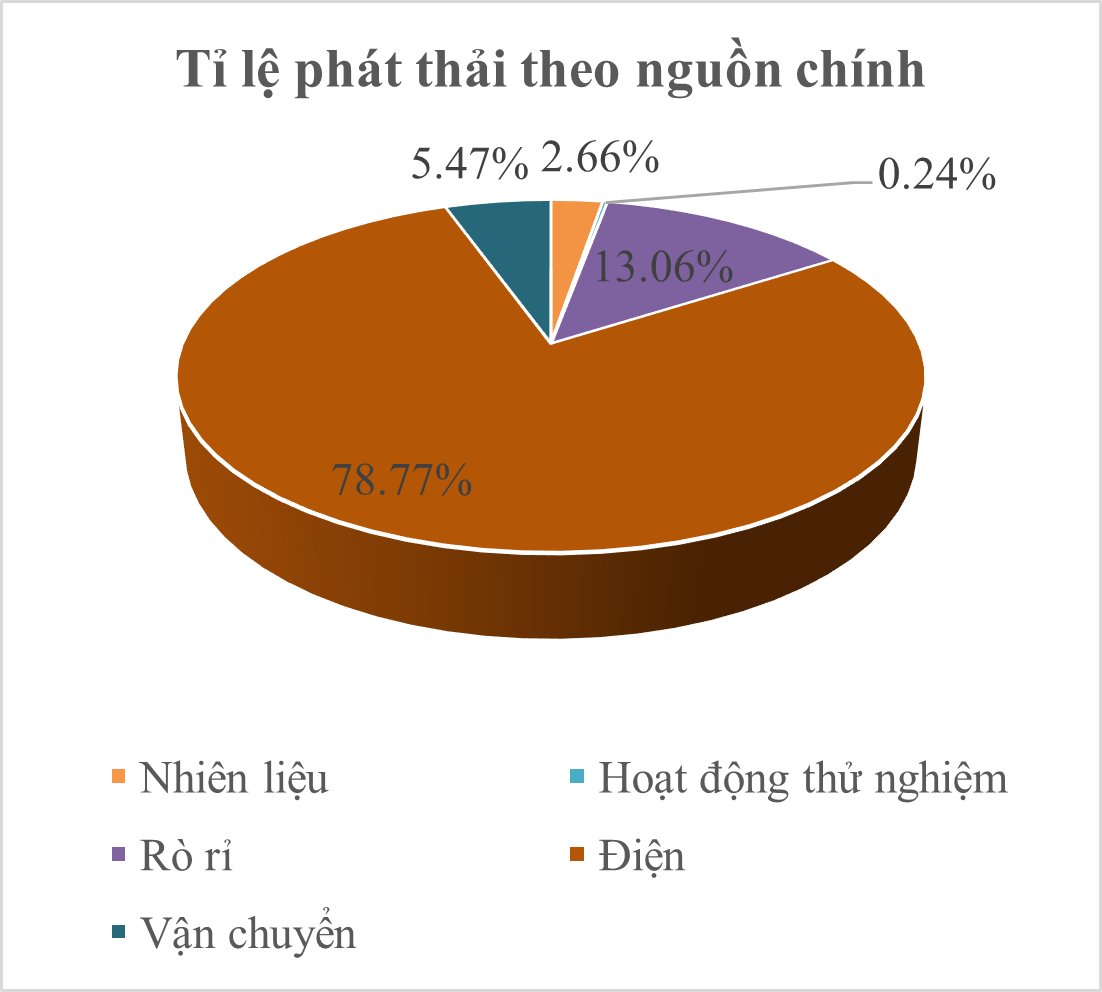

Emissions breakdown by Main Source Categories
- Fuel combustion (generators, forklifts, vehicles): 2.66% with 74.62 tCO2e
- Testing and analysis activities (sample analysis, laboratory testing): 0.24% with 6.8 tCO2e
- Leaks (refrigerants, fire extinguishers, wastewater treatment systems): 13% with 365.97 tCO2e, primarily from refrigeration systems R22, R32, R134A, R410A.
- Electricity consumption: 78.7% totaling 3,349,125 kWh, equivalent to 2,207.74 tCO2e
- Business travel (care, planes, taxis): 5.4% with 153.33 tCO2e
Commitment and Development Direction
QUATEST 3 affirms its commitment to conducting regular GHG inventories, not only to comply with the legal requirements but also to foster a culture of environmental responsibility. In the next phase, the center plans to implement automated software systems for data collection and processing while expanding the inventory scope to cover its entire network of branches if any. This initiative forms part of QUATEST 3 broader sustainable development orientation and its alignment with international standards.
QUATEST 3 has outlined a series of targeted solutions and plans to reduce emissions, including:
- Strengthening refrigeration system maintenance, replacing leaking equipment
- Replacing all lighting with energy-efficient LED systems
- Optimizing generator operations, utilizing cleaner fuels
- Encouraging the use of public transportation and promoting carpooling
- Evaluating the potential for rooftop solar power installation at experimental facilities.
With a total emission volume of 2,802.89 tCO2e in 2024, QUATEST 3 has successfully completed a comprehensive and detailed GHG inventory for all relevant sources. This strategic move enables the entity to gain a clear understanding of its carbon footprint, thereby developing appropriate mitigation plans. The pioneering implementation of GHG inventories also enhances QUATEST 3’s reputation as an environmentally responsible technical service provider. This effort is particularly significant in the context of Vietnam’s commitment to achieving net-zero emissions by 2050, and businesses and service firms like QUATEST 3 will play a vital role.
QUATEST 3